

History of Flowchart
Flowchart is a Process Oriented Graphical Method to re-present an Application Program Algorithm or Organization Functional Flow with unique Symbols. Algorithm is an effective method to re-present a problem and provide a solution by using limited sequence of instructions.
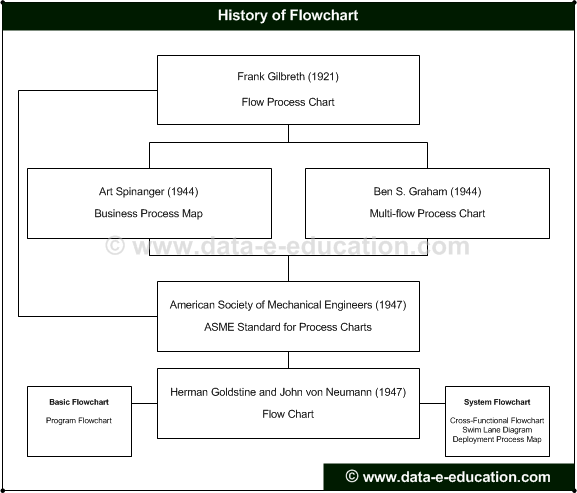
1921, Frank Gilbreth was invented a Structured Method for Documenting Process Flow is called "Flow Process Chart" to Analyze and Enhance Industrial Engineering Process Flow by using unique Symbols. Early 1930, Allan H. Mogensen was trained many Business People with definite Industrial Engineering Tool and Technique.
1944, Art Spinanger was invented "Business Process Map" from "Flow Process Chart" Concept to Analyze and Enhance Business Process Flow in the Trade Industry. 1944, Ben S. Graham was invented and introduced "Multi-flow Process Chart" from "Flow Process Chart" Concept to display multiple documents and documents relationships in the Information Processing Industry.
1947, American Society of Mechanical Engineers adopted and introduce Symbol Set that derived from Frank Gilbreth original work is called "ASME Standard for Process Charts". 1947, Herman Goldstine and John von Neumann were invented and introduced "Flow Chart" from "Flow Process Chart" Concept to Analyze, Design and Enhance Computer Programs in the Information Technology.
Early 1970, Computer Terminals and Third Generation Program Languages was invented and Flowchart important reduced and then invented Data Oriented and Object Oriented Graphical Method from this Process Oriented Approach to re-present a System and Application in the Information Technology.
Flowchart is a Process Oriented Graphical Method to re-present an Application Program Algorithm or Organization Functional Flow with unique Symbols. Algorithm is an effective method to re-present a problem and provide a solution by using limited sequence of instructions.
1921, Frank Gilbreth was invented a Structured Method for Documenting Process Flow is called "Flow Process Chart" to Analyze and Enhance Industrial Engineering Process Flow by using unique Symbols. Early 1930, Allan H. Mogensen was trained many Business People with definite Industrial Engineering Tool and Technique.
1944, Art Spinanger was invented "Business Process Map" from "Flow Process Chart" Concept to Analyze and Enhance Business Process Flow in the Trade Industry. 1944, Ben S. Graham was invented and introduced "Multi-flow Process Chart" from "Flow Process Chart" Concept to display multiple documents and documents relationships in the Information Processing Industry.
1947, American Society of Mechanical Engineers adopted and introduce Symbol Set that derived from Frank Gilbreth original work is called "ASME Standard for Process Charts". 1947, Herman Goldstine and John von Neumann were invented and introduced "Flow Chart" from "Flow Process Chart" Concept to Analyze, Design and Enhance Computer Programs in the Information Technology.
Early 1970, Computer Terminals and Third Generation Program Languages was invented and Flowchart important reduced and then invented Data Oriented and Object Oriented Graphical Method from this Process Oriented Approach to re-present a System and Application in the Information Technology.
|
|
Download e-Book 
Copyright © 2010 data-e-education.com. All rights reserved.